%20GIF.gif?width=200&name=HammerTech%20Intelligence%20(HTI)%20GIF.gif)

Data is big talk these days. It's everywhere, and everything you do. You're gathering data points that businesses are using to better understand you. Is it getting creepy? Kinda'. But it's also getting really cool. Especially for construction. And even more so for safety and quality within construction.
If you think about all the day to day processes on your job sites, you can start to see that there are tens of thousands of data points that can be gathered. And here's why that's a good thing.
You can't see everything in real time.
You can't know how you're really doing when it comes to operational efficiencies, or keeping your sites safe or even clean. Subjectively, you can think everything is fine and you're operating at an 80 out of 100. But you can't see every team member or follow them around everyday to ensure their taking the correct actions to ensure safety and quality. You can't be sure that you're hitting your KPIs if you don't have enough data to benchmark your performance or show you where and why you might be missing them.
Technology is helping you see more through data.
Data insights tell you an objective, more complete story. And you can make safer predictions, test impacts by comparing historical data to time-bound data to understand if changes in protocols enhance or delay performance or productivity. You can even correlate key human factors, like overtime, to performance and safety.
By using technology, you can see data in real time and shift operationally or functionally to ensure better outcomes. You can become more agile, using a more complete knowledge base versus just "gut feel". (Although your gut is important too!)
Paper is a problem. But so are singular function apps.
When you start incorporating more tech onto your job sites, you're starting to gather key data points that are easier to capture than using Excel or pen and paper. That's an important start to stepping into the data world. But there's one major obstacle to these "point solutions" and it's called data siloes. While it's great you're gathering data and starting to see some cool things, that data is siloed in a solution that requires an operator to extract it, and then aggregate it, and then analyze it alongside data points that may not match.
When you use single function apps alongside a complex operational journey, you lose data within the gaps. You lose data from the double-entry chaos. You lose data from mismatched protocols (lack of standardization). You lose data from in-operability between apps. So you can't see the whole picture.
Your data has functional dependencies required to tell you the whole picture of what's happening on your job site.
Platforms and data. This is where your data thrives.
Platform software pulls together key operational functions that match how data and operations should flow on a job site. It's an integrated tech hub that unifies key processes to ensure information flow, collaboration, and communication. Platforms break down the siloes of singular functions because that's NOT how job sites work. You don't have one person for each activity. You can't segment operations so cleanly. You have to combine everything and know everything because of all the functional dependencies on each site, within each build.
Data is the same. Your data has functional dependencies required to tell you the whole picture of what's happening on your job site. How do you know if you're crane operator has worked too many hours and may start becoming unsafe, compared to performance from operators who have worked less? And how does that correlate to your safety indicators, poor quality, equipment operations, or incidents on site?
Can you gain insights on your subcontractors, capture their business health scores or compare trade partners by safe or unsafe observations, and cross reference that with their number and type of inspections and issues?
That's the power of data gained from using a platform. You can see more and do more when your data points are living and working together.
Data points are great, but stories are better.
With the thousands of data points you can gather from a software platform, you can quickly become overwhelmed. It's like going to Costco for a loaf of bread. We totally get that.
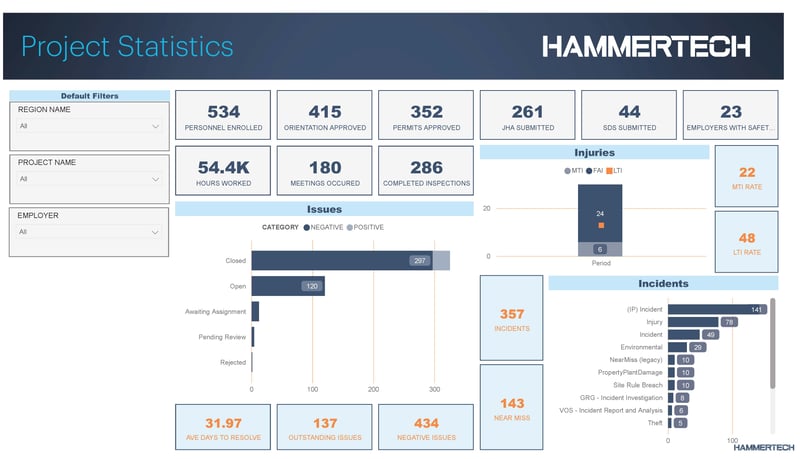
What you need to understand is the story that data is telling you. That's where data visualization plays a key role. Third party plug ins like Tableau or Power BI pull your data in real time to show you your stories, creating pictures, graphs, charts, that help you see what's happening. You can see spikes, drops, compare lines on a chart. These visual aids help you understand your leading or lagging indicators. They help you benchmark performance over time so you can see how your teams are performing against expectations. And who you might need to spend more time with based on their performance or productivity charts.
And the great thing about these plug ins... once they are set up, you don't have to do the dirty job of pulling data yourself. They move data through automatically, reducing double-entry errors like duplication, inverting numbers, incomplete inputs, or worse: accidental deletions!
Where we're headed, it's not for guessing anymore.
With data, pretty soon we're going to know more than ever. Because data is everywhere, literally and metaphorically. Businesses are focusing on how to gather, harness, and utilize all this information they're seeing. And it's making a difference. Construction is one industry that is prime to be leaders in using data to increase performance and productivity. We expect that it will have a positive effect on the industry and the workers within it, keeping each healthier and safer. And that's going to be exciting to be a part of!
--
See what insights you can get with HammerTech: